Editor’s note: Choosing between VUG vs VTV depends on your macroeconomic outlook and international tax profile: Vanguard Growth ETF (VUG) excels in stabilizing interest-rate environments and maximizes tax efficiency for non-US investors through low dividend distributions, whereas Vanguard Value ETF (VTV) provides defensive cash flows and lower volatility during inflationary or high-rate cycles.
Instead of guessing which style will win next quarter, smart global investors evaluate how each fund’s sector exposure interacts with Federal Reserve policy and cross-border dividend withholding rules.
Wall Street analysts love to complicate the growth-versus-value debate with dense academic models, leaving international investors wondering where to allocate their hard-earned US dollars. We have simplified this framework so you can see exactly what is under the hood of both Vanguard powerhouses without the confusing jargon.
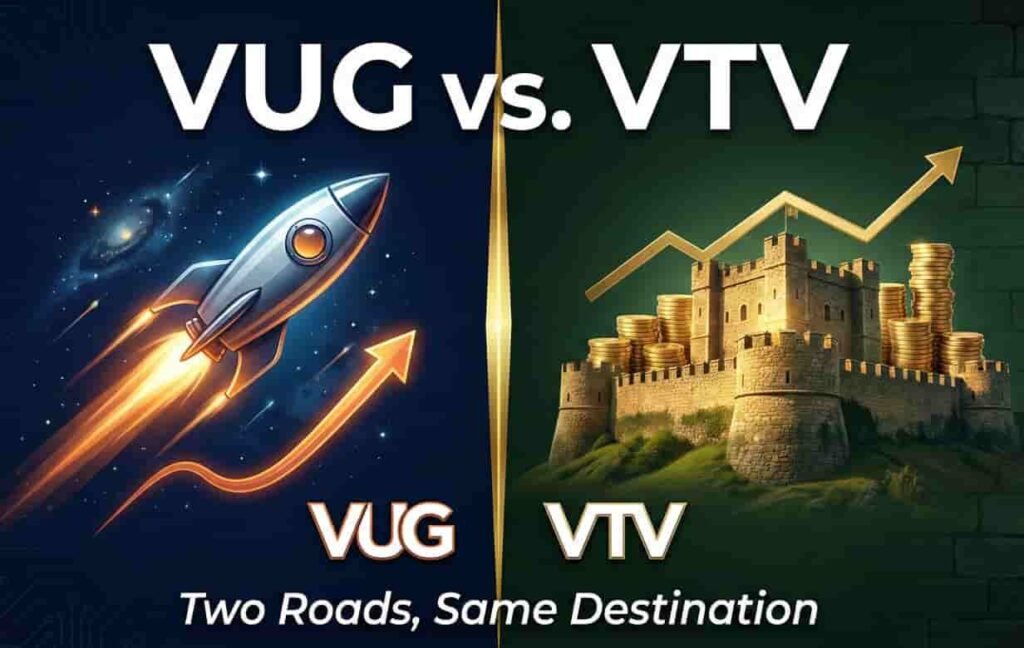
Whether you are an expat building long-term wealth or a non-resident optimizing your brokerage account via Form W-8BEN, understanding how VUG and VTV complement or replace benchmark funds like SPY and QQQ will help you build a resilient portfolio.
Core Indexes: How VUG & VTV Actually Work
At first glance, both VUG and VTV look like typical low-cost Vanguard funds charging an ultra-low 0.04% expense ratio, yet they track completely different segments of the US equity market. VUG follows the CRSP US Large Cap Growth Index, targeting companies with rapid earnings expansion, high return on equity, and strong revenue momentum.
Conversely, VTV tracks the CRSP US Large Cap Value Index, selecting mature corporations trading at lower price-to-earnings (P/E) and price-to-book (P/B) multiples while distributing steady dividends to shareholders.
Because the CRSP methodology splits the US large-cap universe down the middle using multifactor scoring, there is virtually zero overlap between these two ETFs. Historical data suggests that VUG behaves similarly to the tech-heavy Invesco QQQ Trust, with nearly half of its weight concentrated in mega-cap technology leaders like Apple, Microsoft and NVIDIA.

Meanwhile, VTV anchors your capital in the real economy through financials, healthcare, and industrials—featuring fortress balance sheets like Berkshire Hathaway, JPMorgan Chase, ExxonMobil, and UnitedHealth Group.
| Metric / Feature | Vanguard Growth ETF (VUG) | Vanguard Value ETF (VTV) |
|---|---|---|
| Underlying Index | CRSP US Large Cap Growth Index | CRSP US Large Cap Value Index |
| Expense Ratio | 0.04% annually | 0.04% annually |
| Approximate Dividend Yield | ~0.50% – 0.60% | ~2.20% – 2.50% |
| Top 3 Sectors | Technology, Consumer Discretionary, Industrials | Financials, Healthcare, Industrials |
| Key Representative Holdings | Apple, Microsoft, NVIDIA, Amazon | Berkshire Hathaway, JPMorgan, ExxonMobil |
| Non-US Tax Efficiency (W-8BEN) | High (Minimal dividend tax drag) | Moderate (Higher dividend withholding drag) |

Macro: Interest Rates, Inflation and Fed Policy
To understand why VUG and VTV take turns outperforming each other, we only need to look at Federal Reserve interest rate cycles and the 10-year US Treasury yield. Growth companies inside VUG derive most of their intrinsic value from cash flows projected far into the future.
Financial experts note that when interest rates spike, institutional analysts discount those future earnings more heavily, compressing tech valuations. When the Fed pauses rate hikes or signals monetary easing, VUG typically captures strong institutional inflows.
On the flip side, VTV thrives when economic growth moderates, inflation remains sticky, or capital becomes expensive. Value companies generate immediate free cash flow today rather than promising profits ten years down the road, allowing banks, energy producers, and healthcare giants to pass higher costs along to consumers.
During the 2022 bear market, when SPY and QQQ experienced sharp drawdowns, VTV acted as a shock absorber, proving why valuation discipline still matters when market euphoria cools down.

Risk and Transparency: Concentration, Tracking Error, and Tax Drag
Every ETF carries hidden structural risks that rarely show up in marketing brochures, starting with top-heavy concentration risk and valuation stretch. In VUG, the top ten holdings account for over 50% of total assets, meaning a single earnings miss from a semiconductor or cloud giant can drag down the entire fund.
Conversely, VTV carries cyclical value-trap risk—where cheap stocks remain cheap due to secular industry decline—though both funds maintain near-zero tracking error thanks to Vanguard’s massive liquidity.
For non-US residents, the most overlooked danger is cross-border tax withholding drag and US estate tax exposure. Without an active tax treaty via Form W-8BEN, the IRS withholds 30% of all dividends paid by US-domiciled ETFs; even with a treaty, most expats pay 15%.
Because VTV yields roughly four times more in dividends than VUG, international investors lose a noticeably larger slice of VTV’s total return to IRS withholding, alongside facing potential Form 1040-NR estate tax rules above $60,000.

Allocation for Non-US Investors and Expats
Building an optimal vug vs vtv allocation outside the United States requires balancing macroeconomic conviction with net-of-tax returns. Because most non-US jurisdictions do not tax capital gains at the US source when you have a valid W-8BEN on file, growth-oriented funds naturally let your capital compound with less friction.
Depending on your residency, risk tolerance, and income goals, you can tilt between these two funds using the practical portfolio frameworks below.
- The Tax-Optimized Growth Tilt (70% VUG / 30% VTV): Ideal for non-US investors in high-withholding countries (30% dividend tax) who want to capture artificial intelligence and technology compounding while minimizing annual IRS dividend leakage.
- The Defensive Rate-Hedge Tilt (40% VUG / 60% VTV): Designed for conservative investors or retirees who prioritize lower portfolio beta, tangible cash flows, and protection against sticky inflation or elevated Treasury yields.
- The Core S&P 500 Replacement (50% VUG / 50% VTV): Combining equal weights reconstructs the broad large-cap market (similar to VOO or SPY) while allowing you to harvest capital gains or rebalance across market cycles.
- The UCITS Alternative Check: If your US brokerage balance exceeds the $60,000 non-resident estate tax threshold, always consult with a qualified tax professional about pairing US ETFs with Ireland-domiciled UCITS equivalents.

Frequently Asked Questions
Is VUG or VTV better for non-US residents facing dividend withholding taxes?
From a pure tax-efficiency standpoint, VUG is generally more advantageous for non-US residents subject to the standard 15% to 30% IRS dividend withholding tax.
Because VUG companies reinvest their profits into research and expansion rather than paying high dividends, its ~0.5% yield creates minimal tax drag. In contrast, a 30% withholding tax on VTV’s ~2.4% dividend yield reduces your annual net return by roughly 0.72% every single year, making capital-appreciation funds much friendlier for international compounding.
How does VUG differ from QQQ for growth-focused portfolios?
While both VUG and the Invesco QQQ Trust focus heavily on mega-cap technology and growth stocks, VUG is broader, cheaper, and less restrictive in its exchange rules.
QQQ only holds the 100 largest non-financial companies listed specifically on the Nasdaq exchange and charges a 0.20% expense ratio. VUG charges just 0.04% and draws roughly 180 to 200 growth stocks from both the NYSE and Nasdaq, including financial innovators like Visa and Mastercard that QQQ automatically excludes.
Can I hold both VUG and VTV instead of a single S&P 500 ETF like SPY?
Yes, holding both VUG and VTV gives you custom control over your growth-to-value ratio rather than accepting the fixed market-cap weights inside SPY or VOO.
When you buy a standard S&P 500 ETF, your exposure automatically shifts toward whichever style is currently most expensive. By owning VUG and VTV separately at the exact same 0.04% fee, you can systematically rebalance—trimming tech winners after a massive rally and adding to undervalued industrial or financial leaders.
Positioning Your Dollar Portfolio for “Next”
Framing the vug vs vtv decision as an all-or-nothing bet misses the biggest advantage of modern ETF investing: flexibility. Economic climates shift constantly as inflation cools, central banks adjust interest rates, and corporate earnings broaden beyond mega-cap technology.
By pairing VUG’s high-octane innovation engine with VTV’s battle-tested cash generators, you remove the stress of timing the exact macroeconomic turning point while keeping your annual management fees near zero.
Before executing your next trade, take ten minutes to review your current US equity exposure, verify that your Form W-8BEN is active with your broker, and calculate how dividend withholding affects your net yield.
Always consult with a certified financial planner or international tax advisor to ensure your asset location aligns with your local residency laws. How are you balancing growth and value in your dollar portfolio this year?