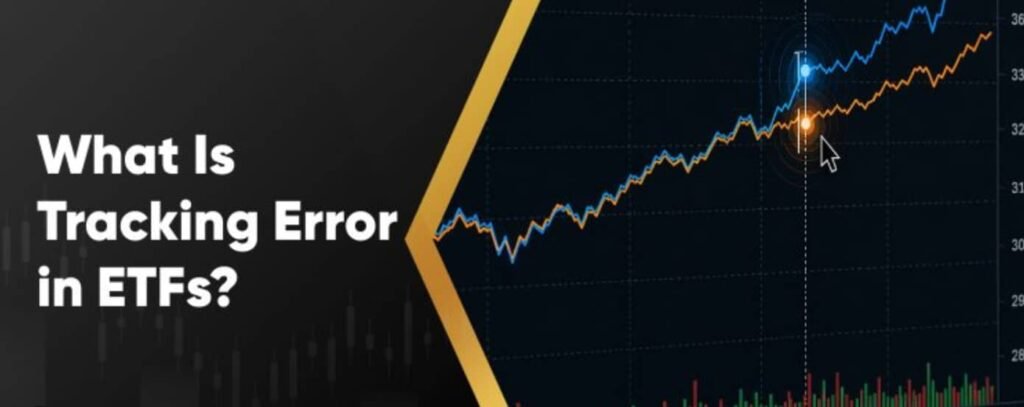
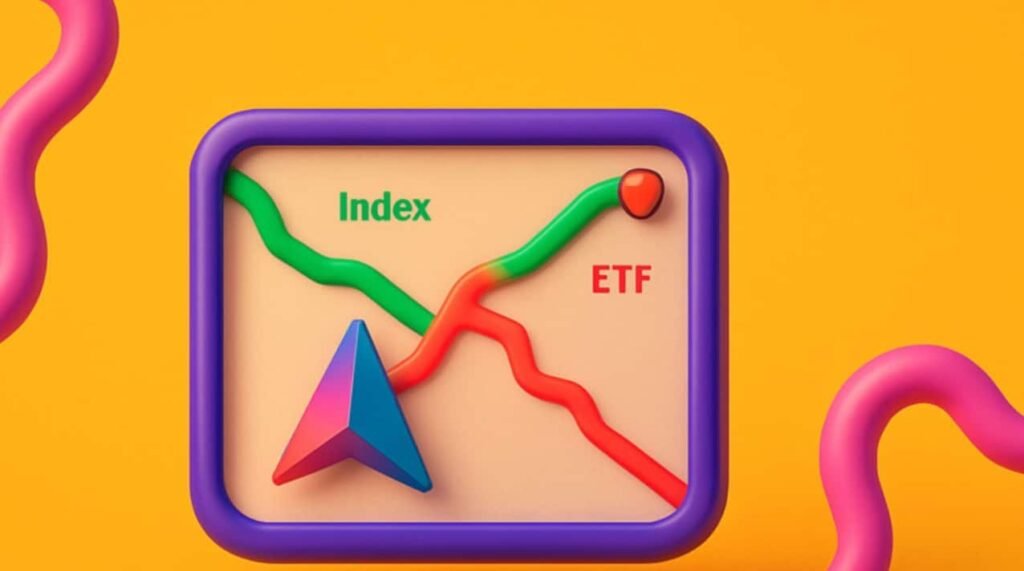
Editor’s Picking: ETF tracking error measures the annualized standard deviation of the return gap between an exchange-traded fund and its benchmark index, driven by expense ratios, cash drag, securities lending, and cross-border dividend tax withholding.
When you purchase flagship American funds like the SPDR S&P 500 ETF Trust (SPY), Vanguard S&P 500 ETF (VOO), or Invesco QQQ Trust (QQQ), your brokerage balance rarely matches the headline index point-for-point. Having etf tracking error explained clearly helps international investors separate unavoidable structural costs from poor fund execution.
For non-US residents and expats building dollar-denominated wealth from abroad, index divergence is far more than a technical curiosity. While domestic US investors primarily compare management fees, international investors navigating IRS Form W-8BEN and Form 1040-NR rules face extra layers of friction from statutory dividend withholding and cash drag during Federal Reserve rate cycles.
Rather than burying you in Wall Street jargon, this guide breaks down the exact mechanics behind index slippage so you can protect your long-term compounding rate.
Tracking Error vs. Tracking Difference
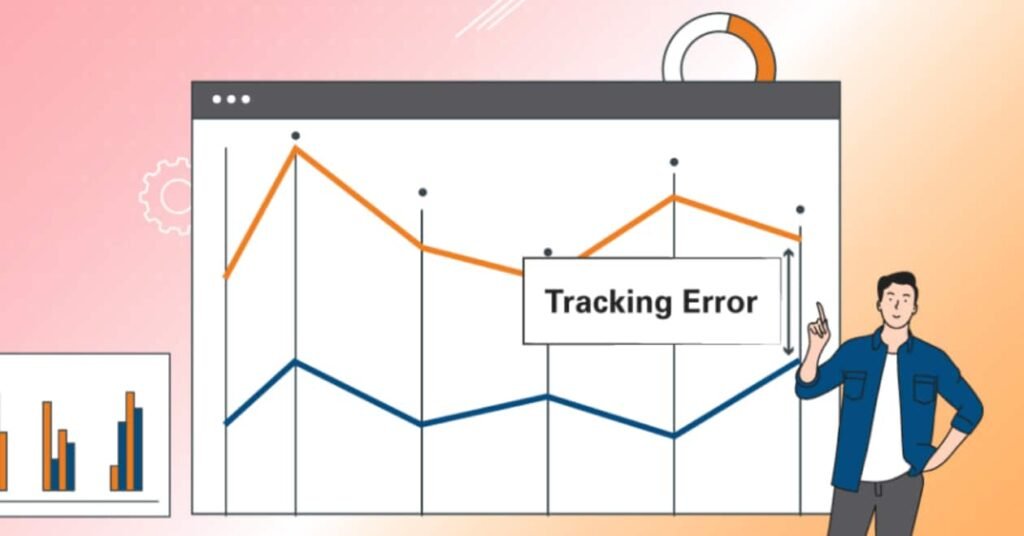
Financial commentators often use tracking error and tracking difference interchangeably, yet they measure two distinct realities inside your portfolio. Tracking difference is the straightforward net return gap between an ETF and its benchmark index over a set period—for example, if the S&P 500 gains 10.00% and your ETF returns 9.91%, your tracking difference is minus 0.09%.
Historical data suggests that long-term investors should prioritize tracking difference because it directly represents the annual drag compounding against your capital.
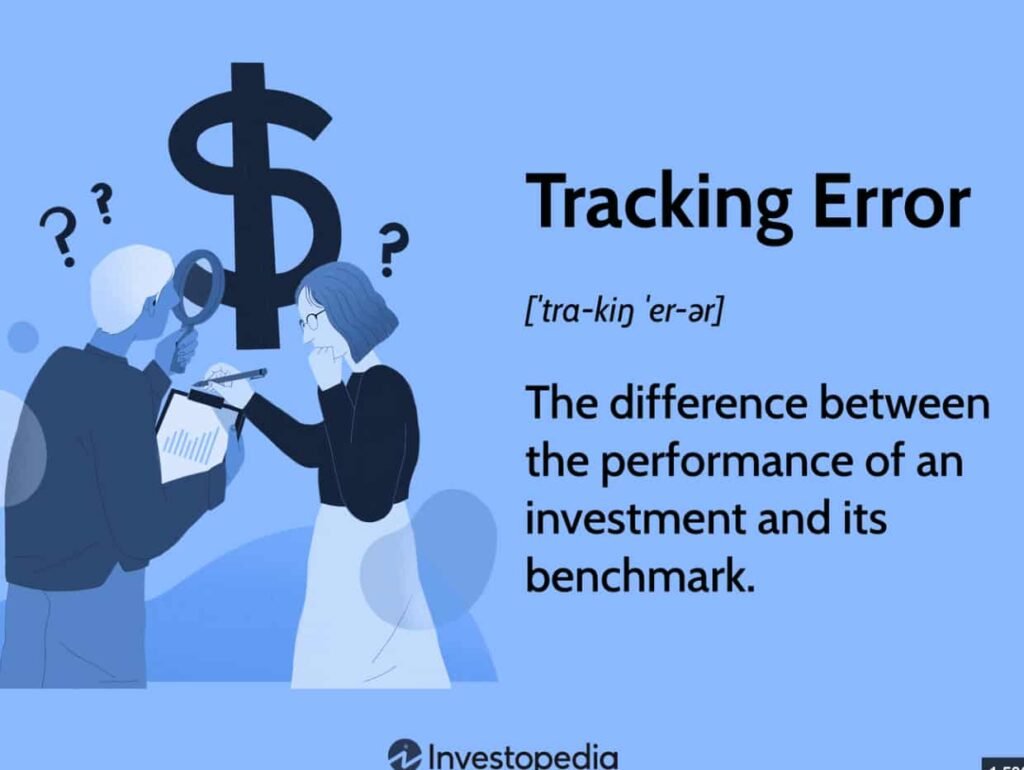
Tracking error, conversely, is a volatility metric defined as the annualized standard deviation of those periodic return differences over time. It measures how steadily or erratically a fund follows its underlying index from month to month.
An ETF can display a near-zero tracking error while consistently trailing its benchmark by its exact fee every quarter, whereas a poorly sampled emerging-market ETF might finish the year close to its index only because wild monthly swings accidentally canceled each other out.
Portfolios and ETF Tracks
Even when institutional giants like BlackRock (iShares), Vanguard, and State Street Global Advisors replicate liquid benchmarks maintained by S&P Dow Jones Indices or Nasdaq, real-world funds face operational frictions that theoretical index formulas ignore.
Portfolio managers must balance physical replication against representative sampling, especially in small-cap funds like the iShares Russell 2000 ETF (IWM). Four core mechanical factors dictate how closely an American ETF tracks its target benchmark:
- Total Expense Ratio (TER) Drag: Theoretical indices incur zero operating costs, meaning an ETF’s annual management fee—from 0.03% on VOO and IVV to 0.20% on QQQ—creates an automatic baseline negative tracking difference.
- Dividend Cash Drag and Structure: Legacy Unit Investment Trusts (UITs) like SPY and QQQ must hold collected cash dividends in non-interest-bearing accounts until quarterly distribution, whereas modern open-end funds like VOO reinvest cash into S&P 500 futures immediately.
- Index Rebalancing and Sampling Friction: When indices reconstitute mega-cap weights like Nvidia, Microsoft, or Apple, or when small-cap ETFs use statistical sampling to avoid illiquid stocks, bid-ask spreads create slight return deviations.
- Securities Lending Revenue: Issuers frequently lend underlying shares to institutional short-sellers, crediting the resulting lending income back to the fund to partially neutralize the annual expense ratio.
Cross-Border Realities: US Tax Rules
When you invest in US equities as a non-resident alien (NRA), your personal portfolio return diverges from the headline S&P 500 Gross Total Return index far more than a domestic American investor’s does. Headline market indices assume that 100% of gross corporate dividends are reinvested without any tax leakage.
In practice, the Internal Revenue Service (IRS) enforces a statutory 30% withholding tax on US-source dividends paid to foreign accounts, reducing your reinvested cash and widening your personal tracking gap.
Filing an active IRS Form W-8BEN with your international brokerage allows residents of tax-treaty nations to reduce that dividend withholding rate, typically to 15%. Financial experts note that international investors should always compare their ETF performance against the S&P 500 Net Total Return (NTR) index—which deducts withholding taxes—rather than the gross benchmark.
Evaluating US-Domiciled ETFs
Evaluating US-domiciled ETFs alongside Irish-domiciled UCITS funds also highlights how legal domicile shapes both net dividend retention and cross-border tax efficiency.
The structured comparison table below breaks down how legal architecture, expense ratios, dividend reinvestment mechanics, and tax withholding rules affect five widely held core equity ETFs.
Reviewing these structural differences side-by-side demonstrates why two funds tracking the exact same 500 American corporations can produce noticeably different compounded dollar returns for a non-US resident over a ten-to-twenty-year investment horizon, especially during periods of strong dividend growth and rising corporate payouts:
| ETF Ticker & Name | Legal Structure | Expense Ratio | Typical 3-Yr Tracking Error | Dividend Handling & Non-US Tax Impact |
|---|---|---|---|---|
| VOO (Vanguard S&P 500) | US Open-End Fund | 0.03% | Less than 0.03% | Reinvests cash via futures; 15% to 30% W-8BEN withholding on payouts |
| IVV (iShares Core S&P 500) | US Open-End Fund | 0.03% | Less than 0.03% | Active securities lending offset; 15% to 30% W-8BEN withholding |
| SPY (SPDR S&P 500 Trust) | US Unit Investment Trust | 0.0945% | Less than 0.05% | Cannot use futures for dividend cash drag; 15% to 30% withholding |
| QQQ (Invesco QQQ Trust) | US Unit Investment Trust | 0.20% | Less than 0.06% | Tracks Nasdaq-100; UIT cash drag applies with lower dividend yield |
| CSPX (iShares Core S&P 500 UCITS) | Irish UCITS (Accumulating) | 0.07% | Less than 0.05% | 15% treaty withholding inside fund; auto-reinvests with no 1040-NR filing |

Invisible Portfolio Threats: Tracking Error, Margin Risk, and Tax Withholding
Beyond headline fees, cross-border investors must guard against three compounding vulnerabilities: Tracking Error, Margin Risk, and Tax Withholding. When investors use margin leverage on global platforms like Interactive Brokers to trade US ETFs, unexpected spikes in tracking error during market sell-offs can distort hedging ratios and accelerate maintenance margin calls.
With Federal Reserve policy rates keeping broker borrowing costs elevated, margin interest combines with bid-ask spreads and tracking slippage to erode account equity rapidly during volatile drawdowns.
At the same time, unrecovered dividend tax withholding reduces the net cash yield that would otherwise help service margin interest or rebalance positions.
Non-US residents holding more than $60,000 in US-situs assets—including US-domiciled ETFs like SPY, VOO, and QQQ—also face potential US federal estate tax exposure up to 40% unless protected by a bilateral estate tax treaty. Always consult with a qualified cross-border tax professional before combining margin leverage with international ETF holdings.
Frequently Asked Questions
What is considered a good tracking error for a US core equity ETF?
For broad US large-cap ETFs replicating the S&P 500 or Nasdaq-100, a strong annualized tracking error is less than 0.10%, with low-cost leaders like VOO and IVV consistently posting 0.02% to 0.05%.
For small-cap or emerging-market ETFs that rely on representative sampling across less liquid stocks, an annualized tracking error between 0.20% and 0.50% is widely regarded as efficient by institutional benchmarks.
Can an ETF ever outperform its underlying benchmark index?
Yes, an ETF can occasionally achieve a positive tracking difference and beat its benchmark over a calendar year.
This typically occurs when the fund manager generates enough securities lending revenue from institutional short-sellers to exceed the annual expense ratio. However, because lending demand fluctuates with market sentiment and SEC collateral rules, investors should never treat positive tracking anomalies as a guaranteed source of extra return.

Does filing Form W-8BEN eliminate ETF tracking difference for non-US residents?
Filing IRS Form W-8BEN does not eliminate fund-level tracking difference, because expense ratios, trading spreads, and cash drag happen inside the ETF before distributions are paid.
However, maintaining an active W-8BEN is essential for shrinking your personal return gap against the gross index, as it lowers the statutory 30% US dividend withholding tax to your country’s applicable tax treaty rate.
Your Cross-Border ETF Audit Actions
Evaluating an exchange-traded fund effectively requires looking past the marketing pitch of a rock-bottom management fee. When you compare a fund’s three-year Net Asset Value (NAV) performance against its Net Total Return index on its official fact sheet, you reveal the true cost of ownership.
Whether you favor open-end US giants like VOO and IVV for penny-wide liquidity or Irish-domiciled UCITS funds for estate tax simplicity, aligning fund mechanics with your residency protects every basis point.
Set aside fifteen minutes this week to audit your current brokerage holdings, confirm that your Form W-8BEN certification has not expired, and inspect the historical tracking difference of your core US equity positions.
Swapping out a structurally lagging fund that loses 0.20% annually to avoidable cash drag or tax friction can preserve thousands of dollars in compounded wealth over a twenty-year horizon without adding a single unit of extra market risk.